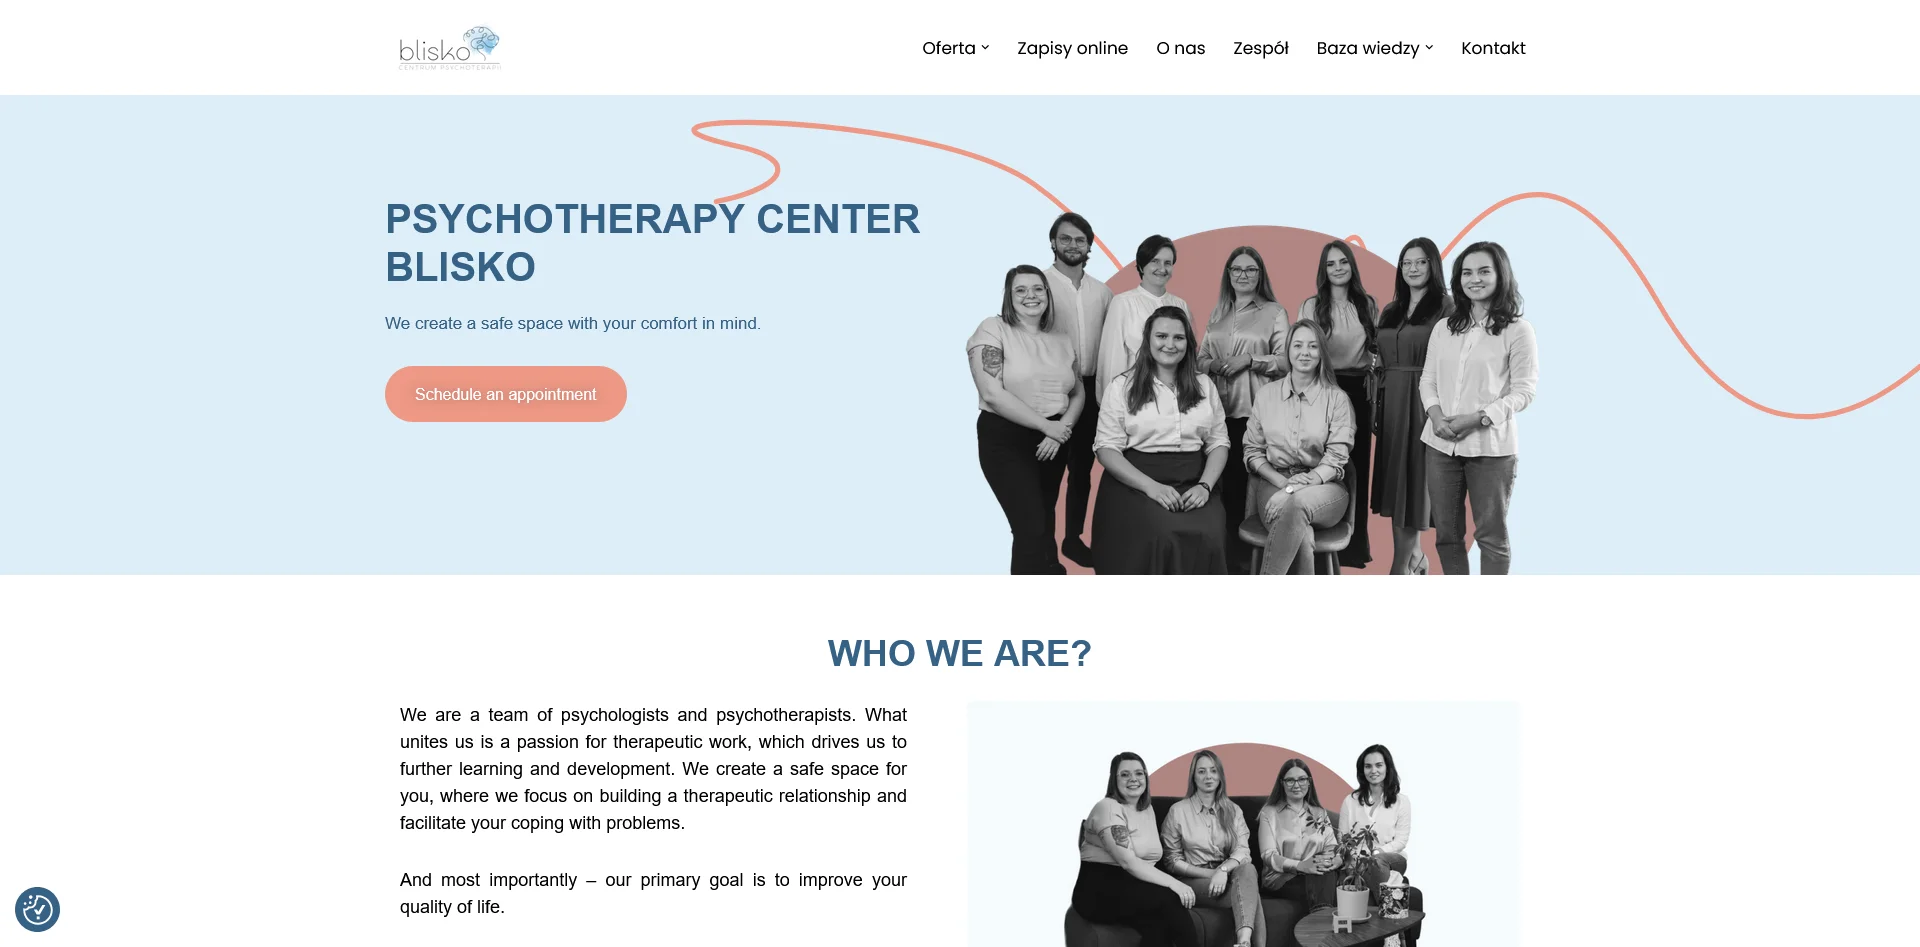
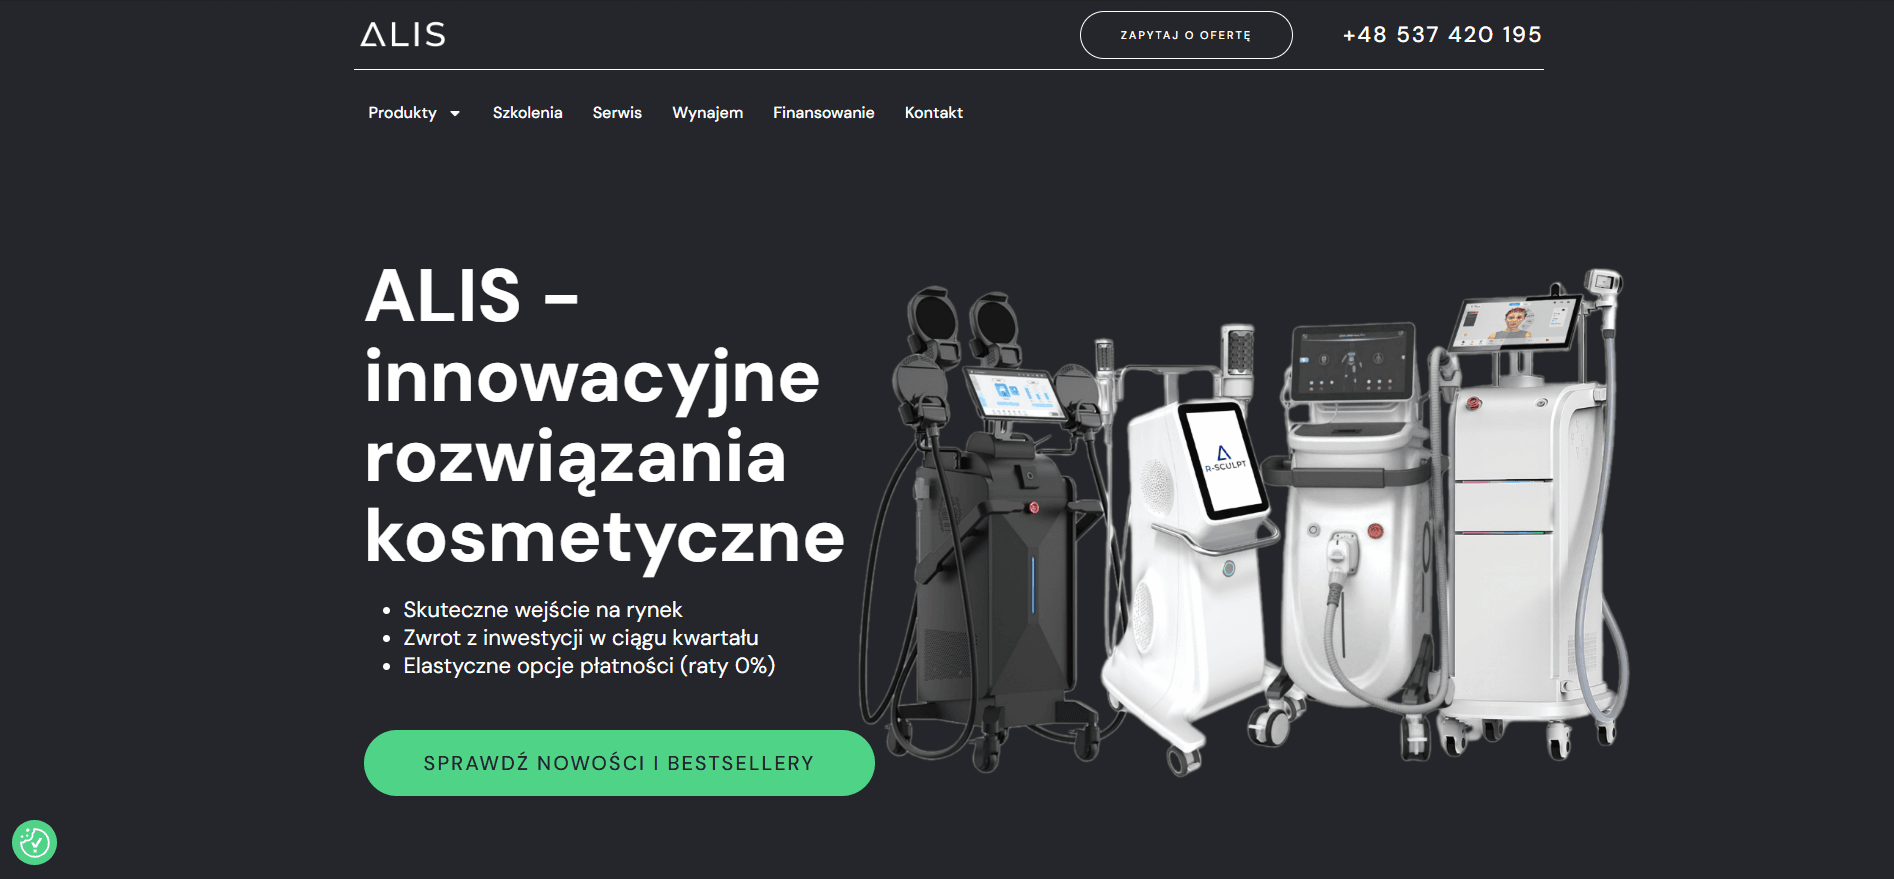
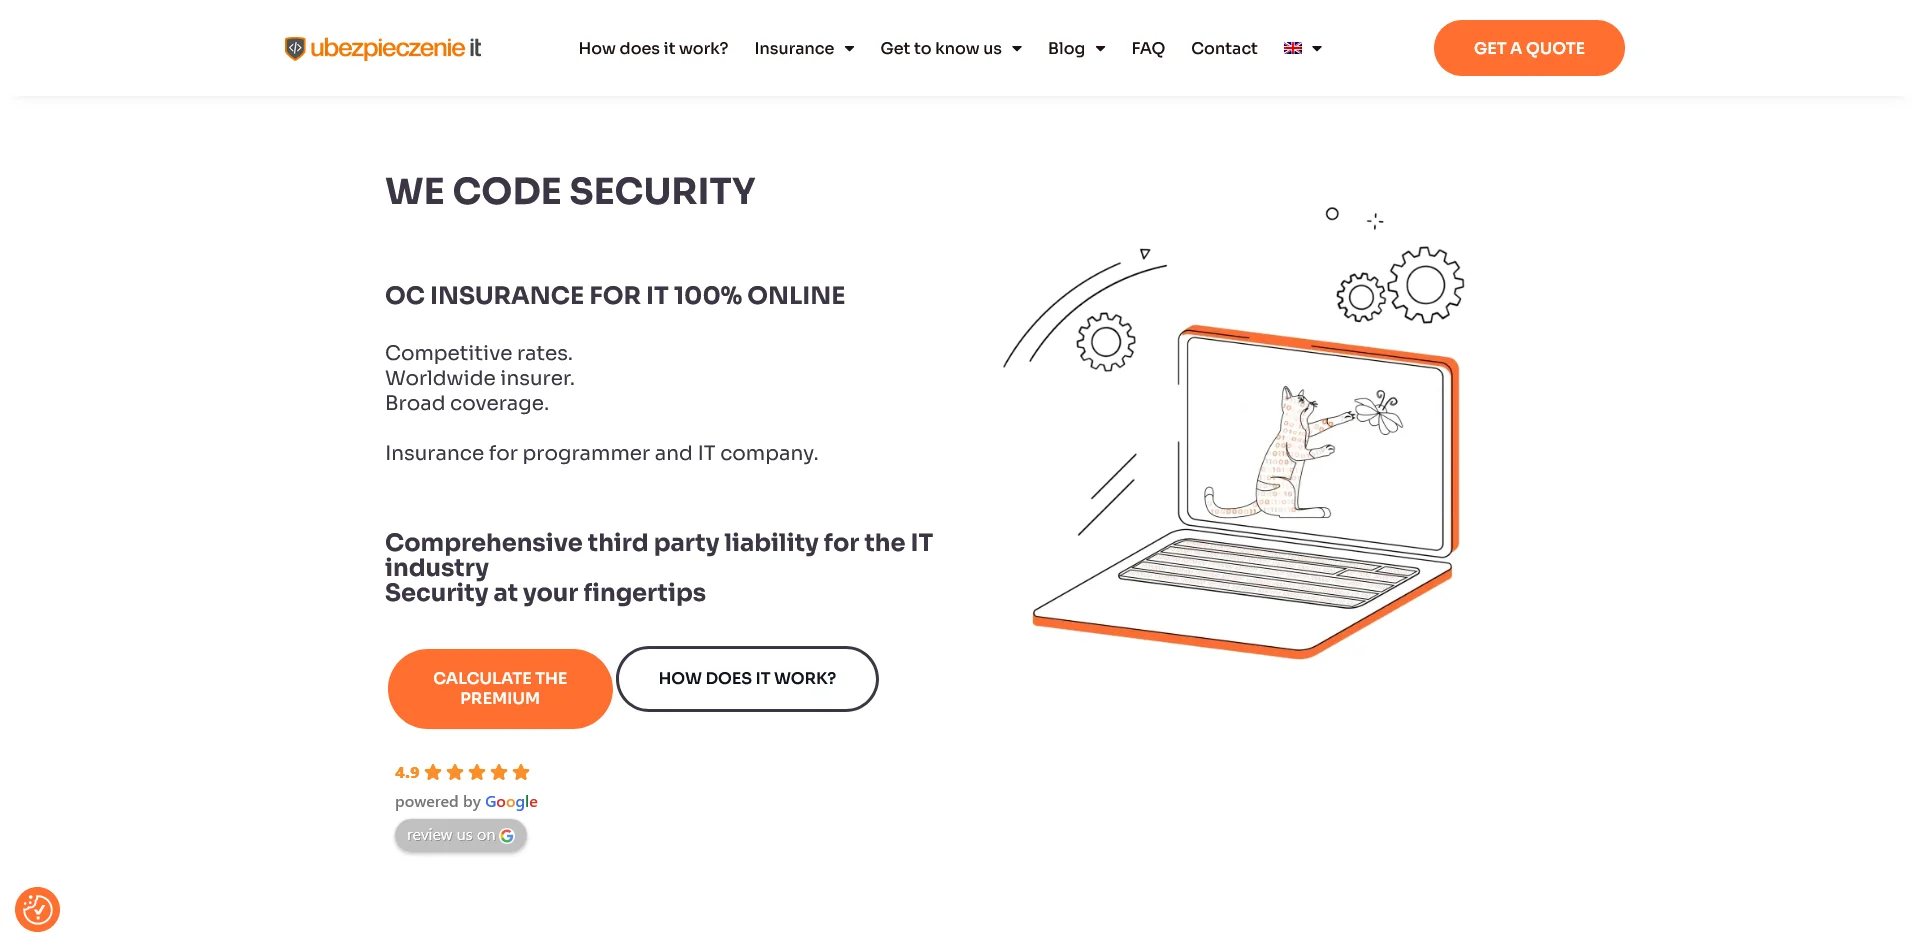
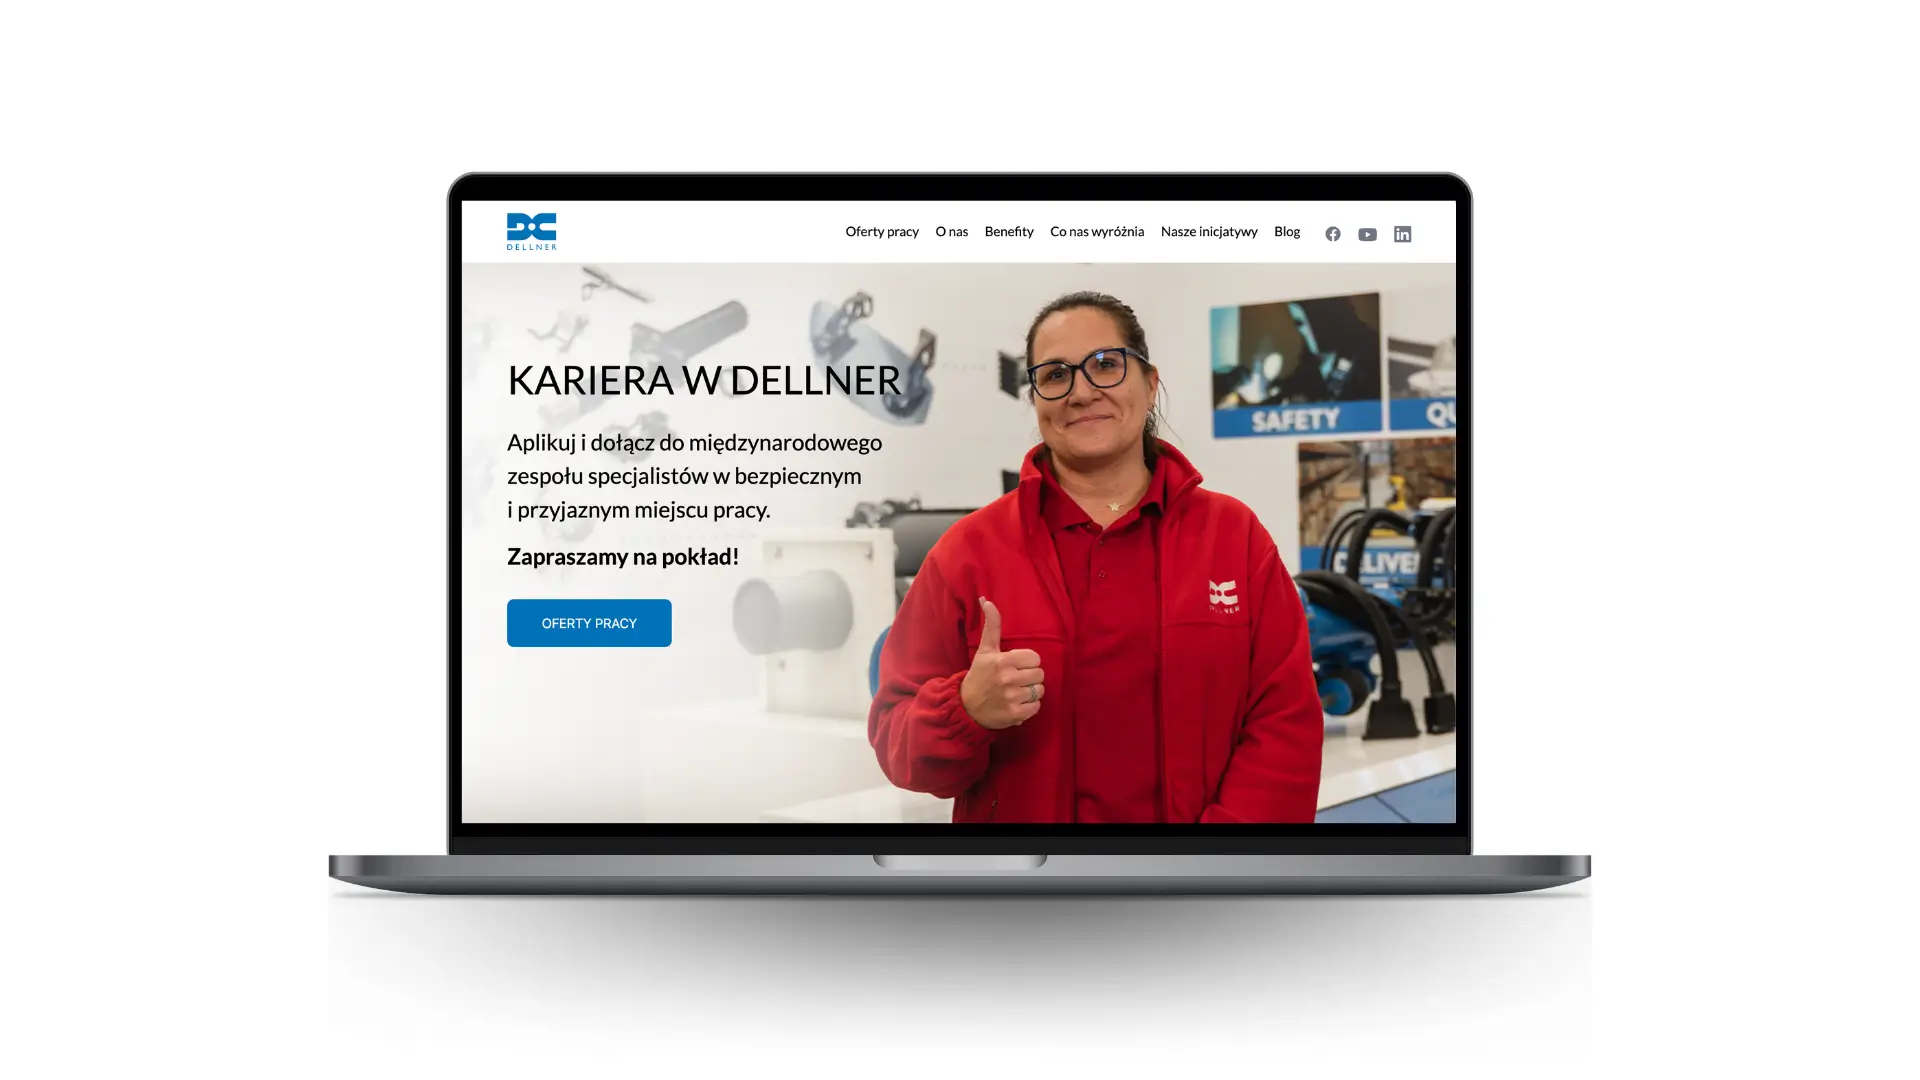
Comprehensive recruitment marketing services, creating a website and reaching 100,000+ people.
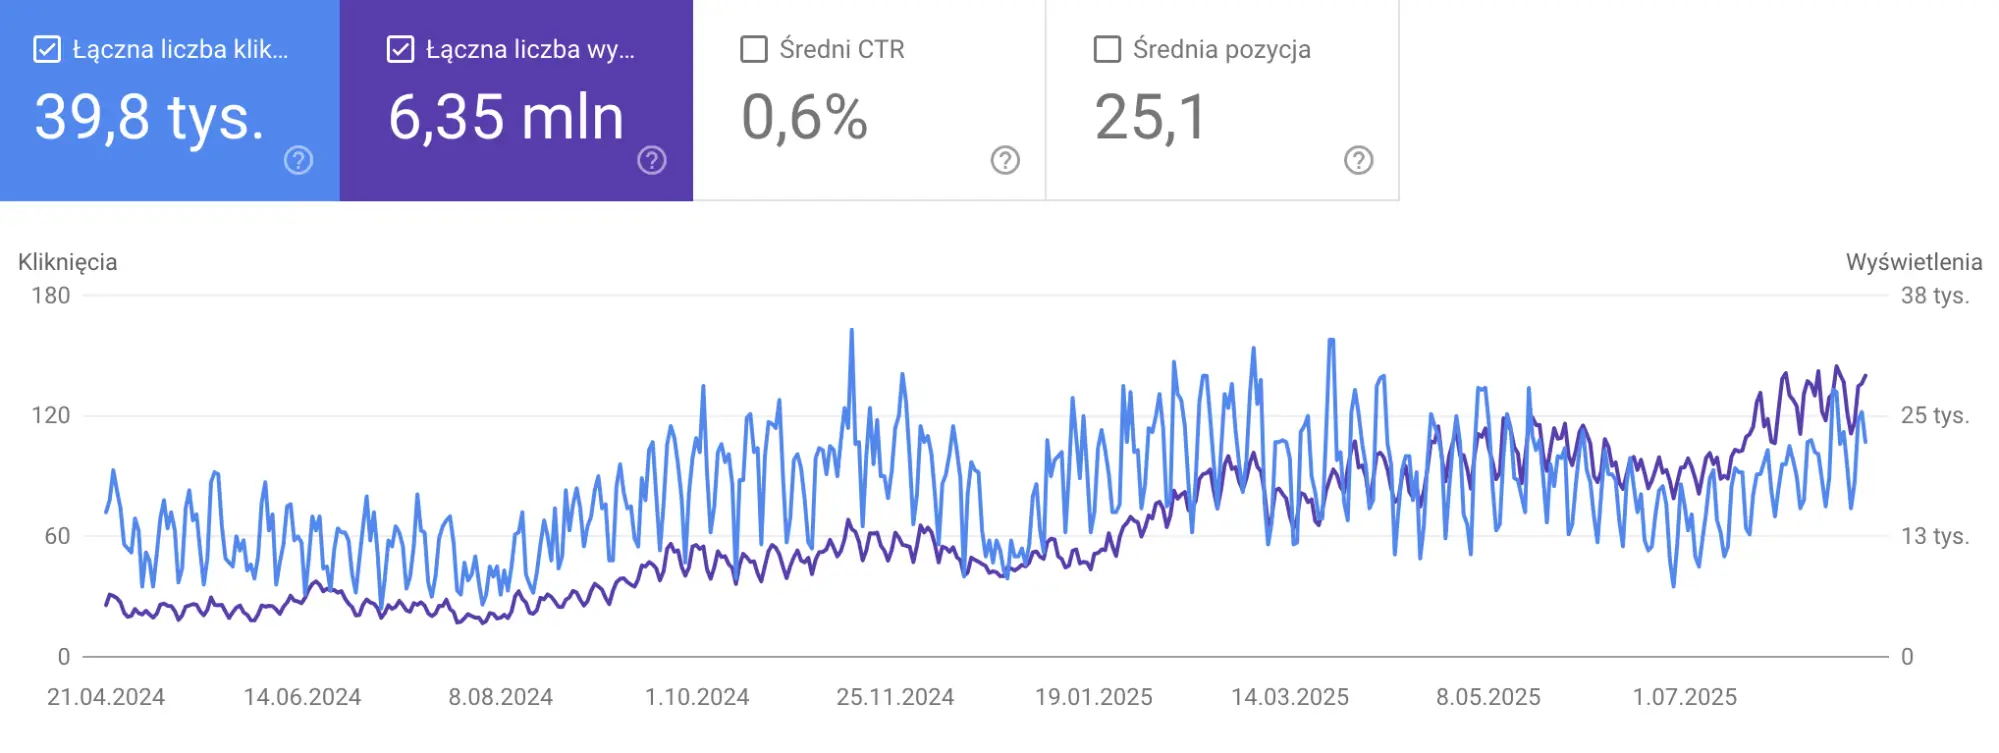
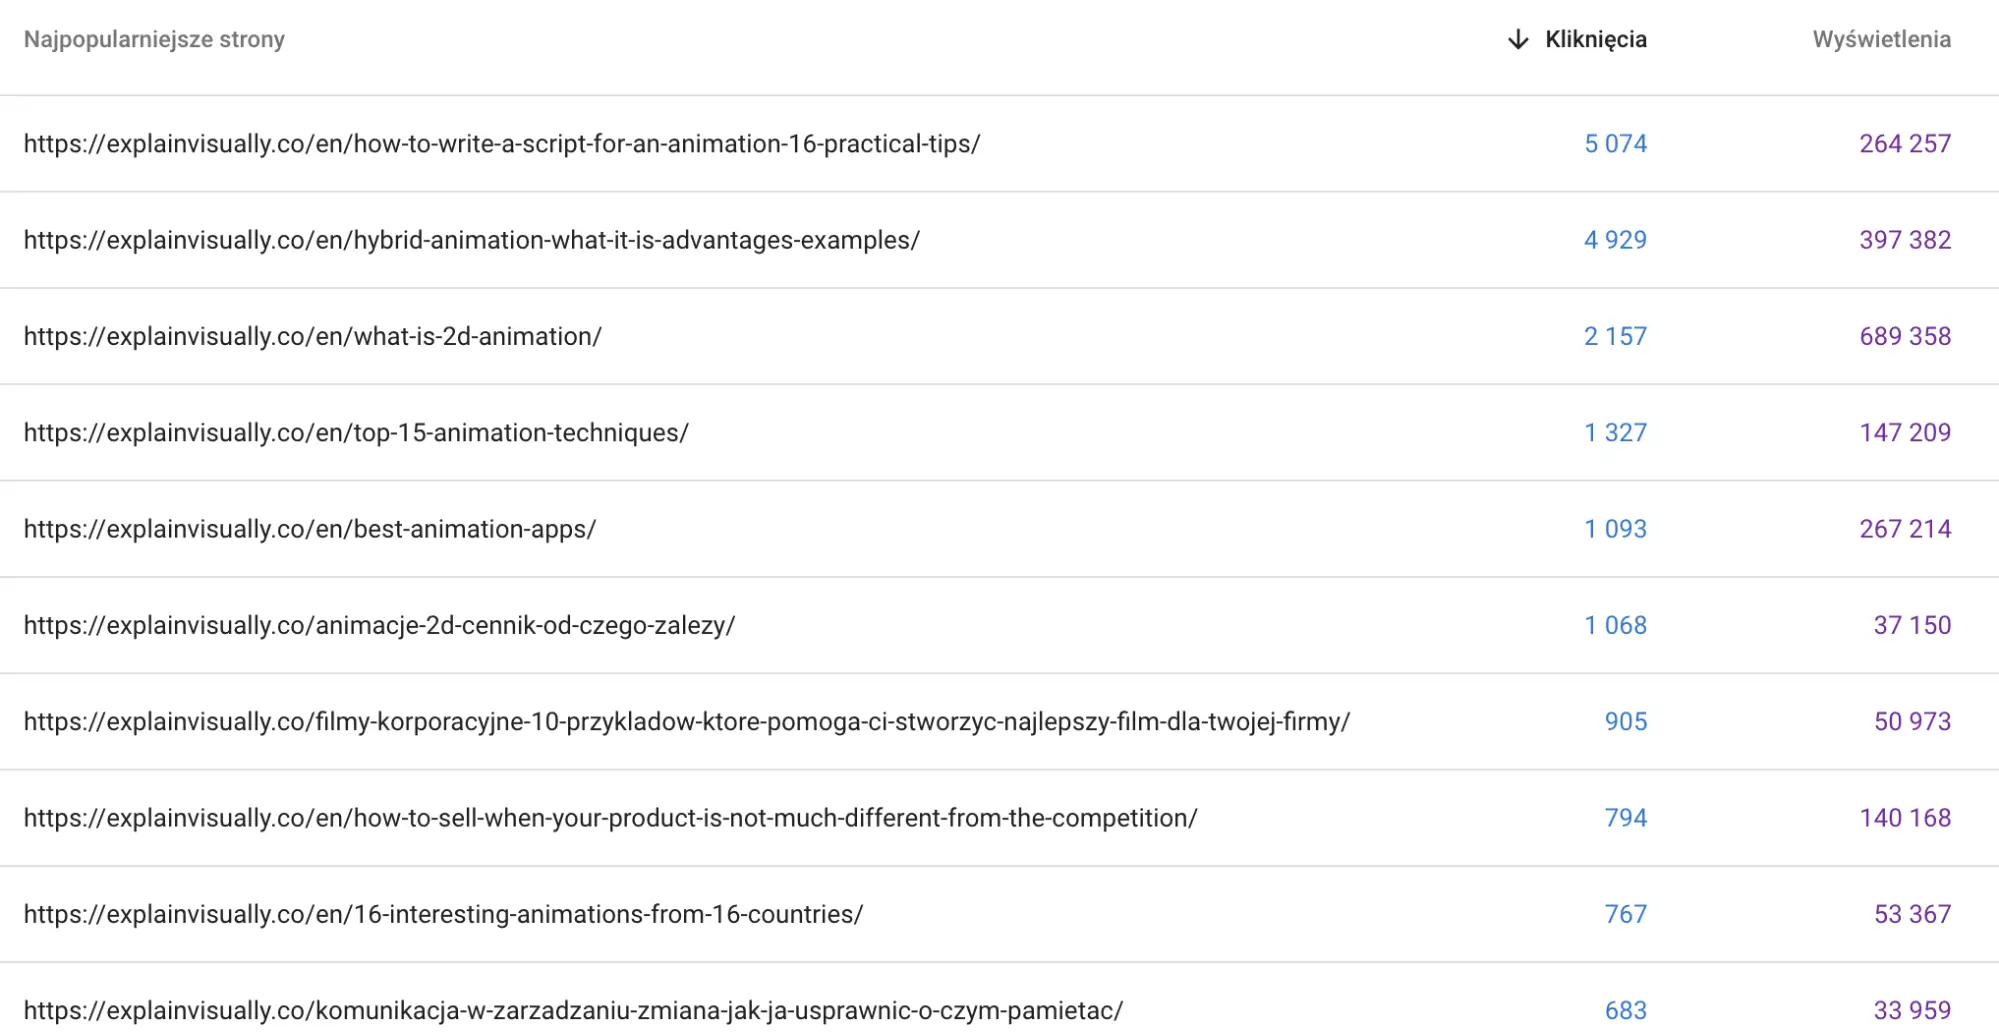
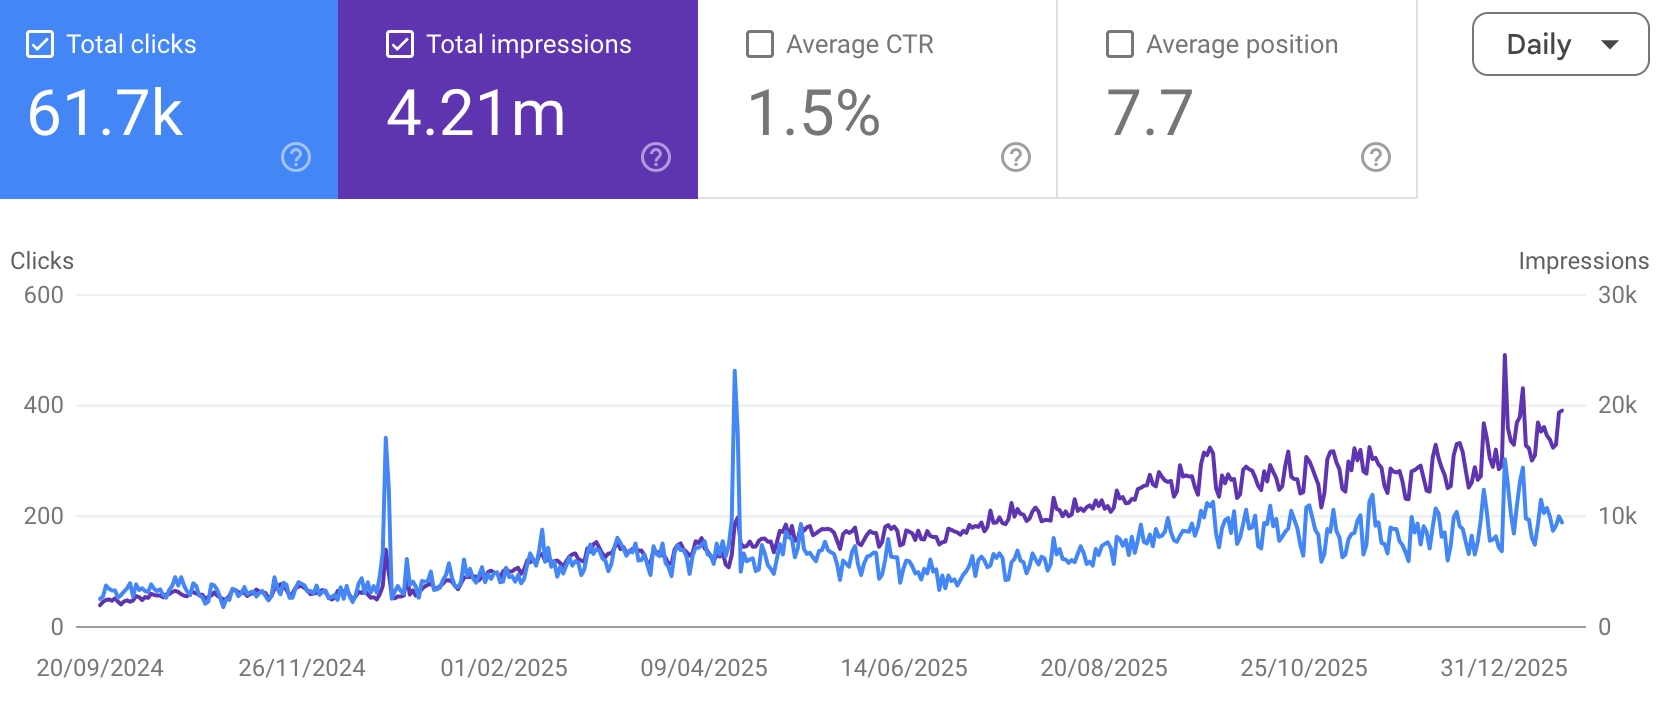
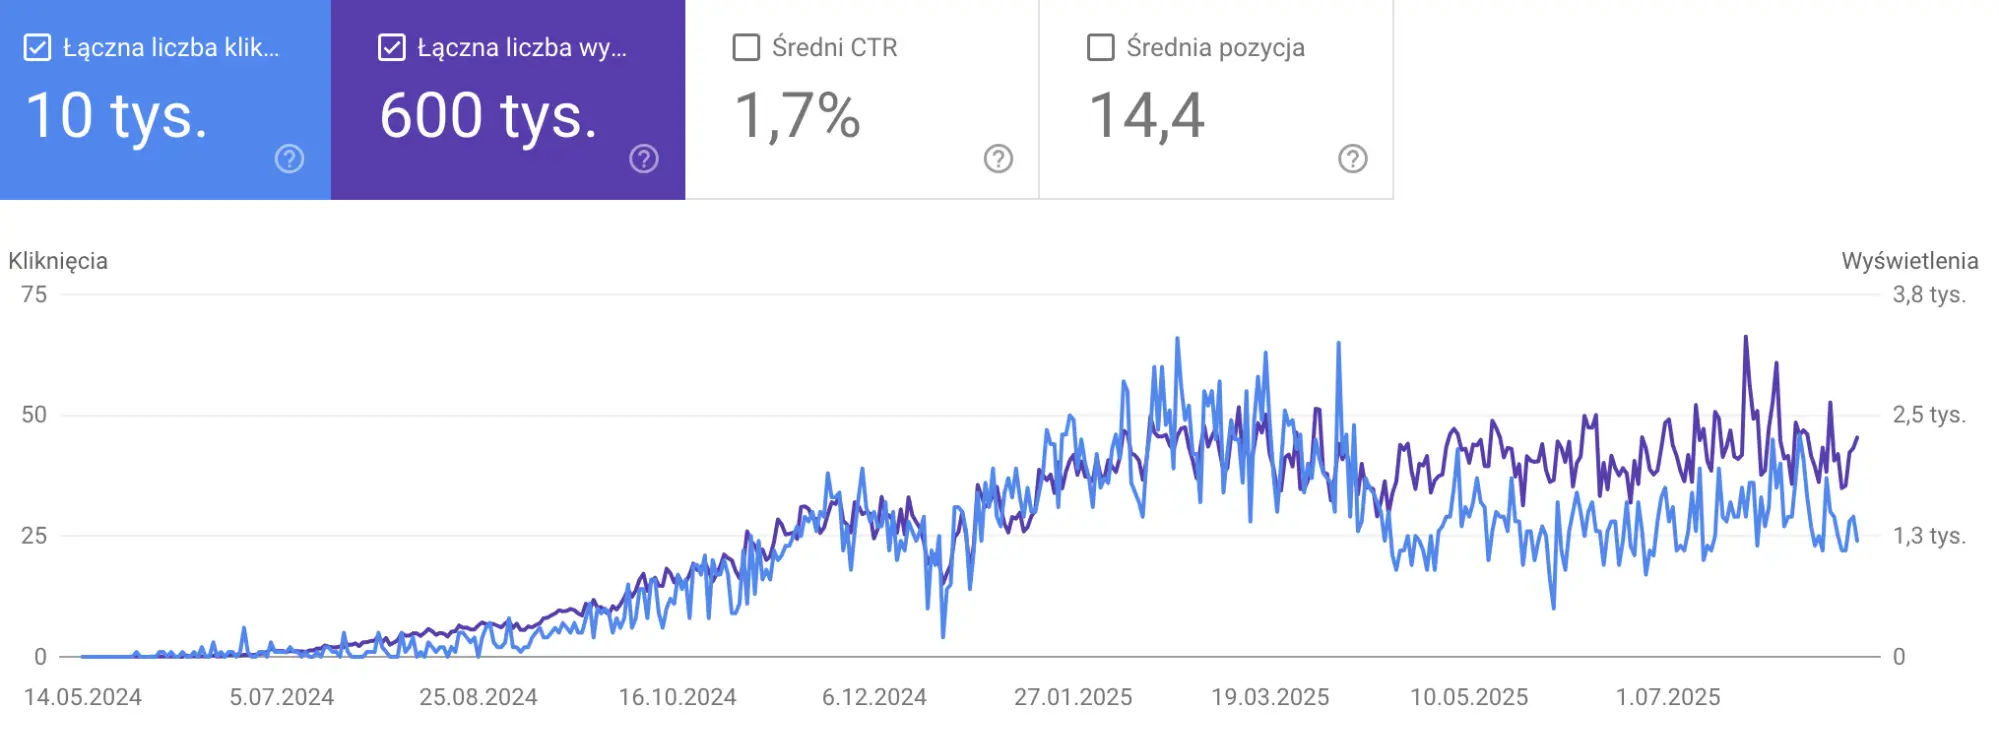
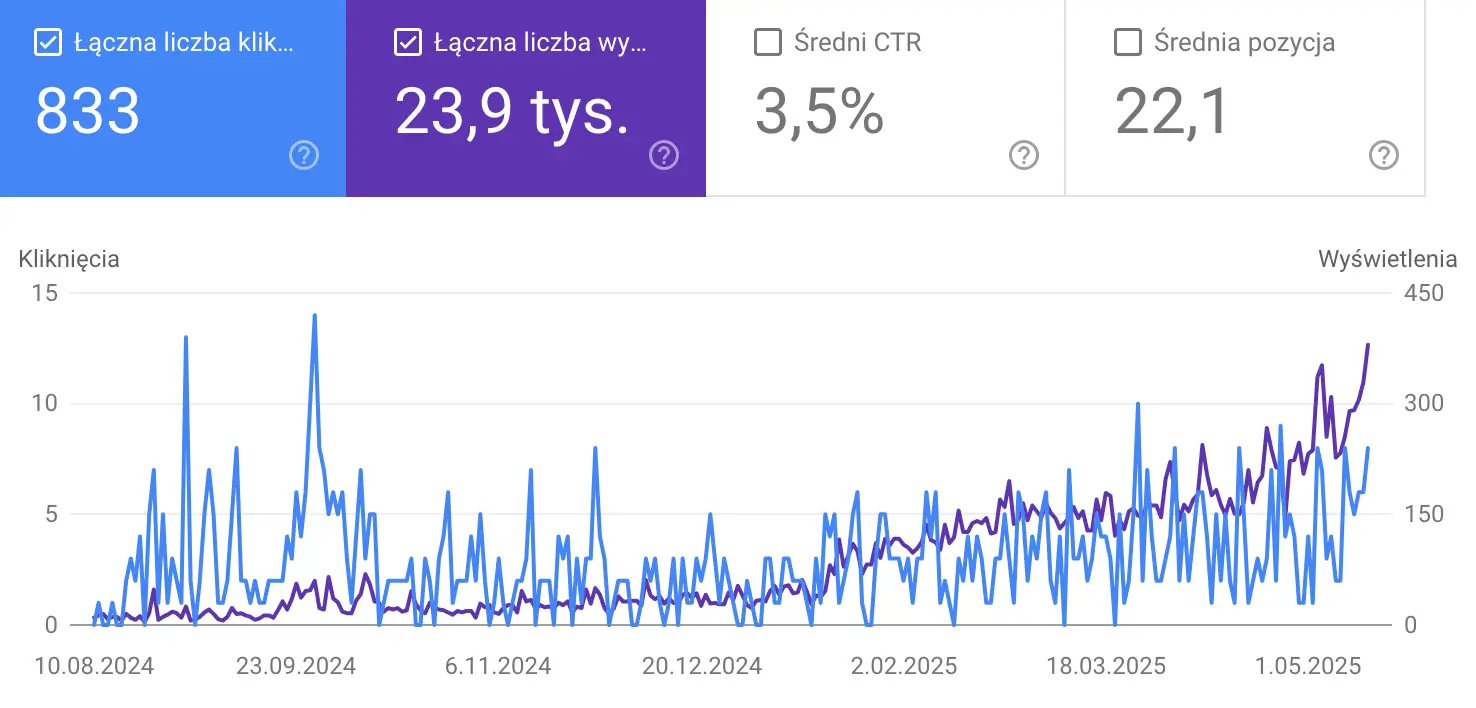
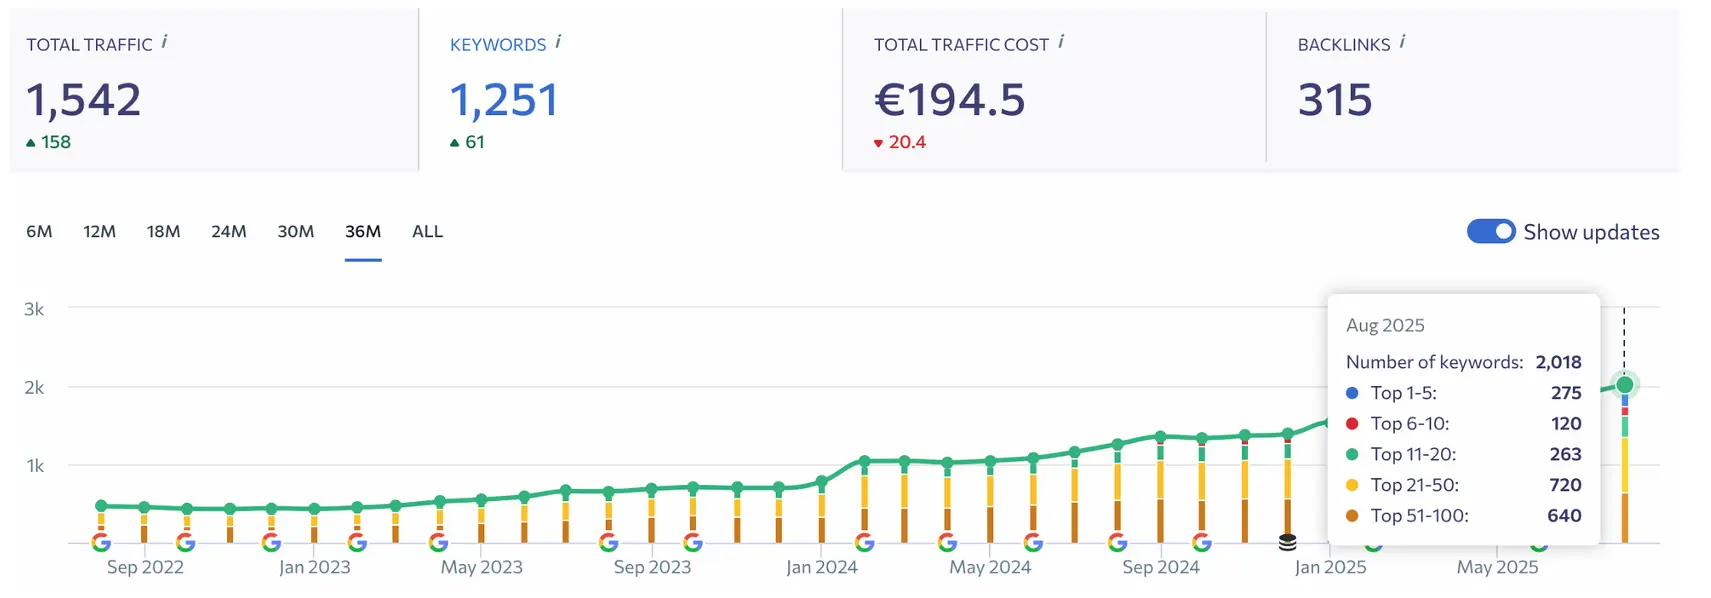
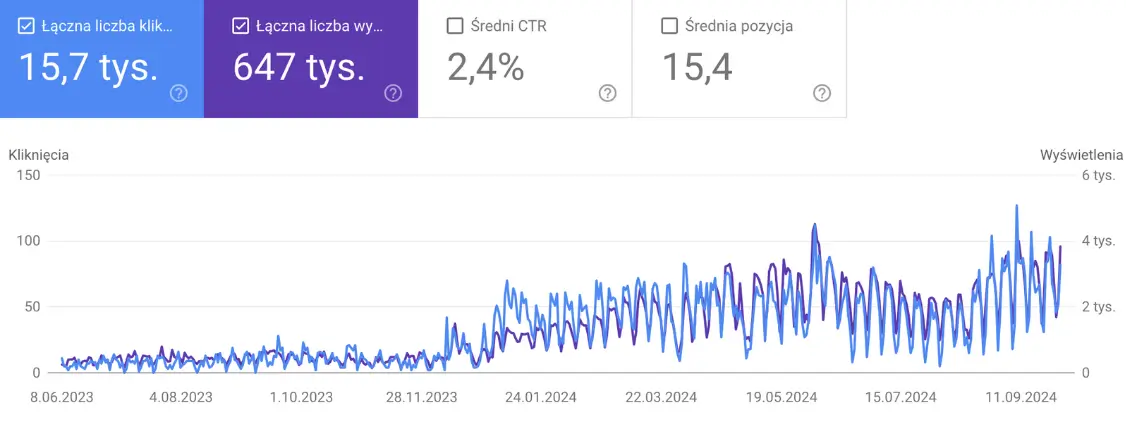
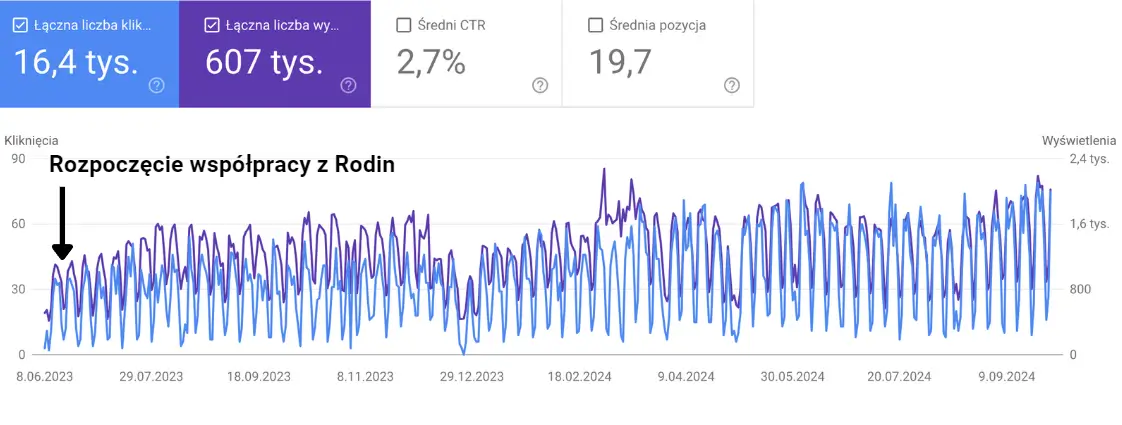
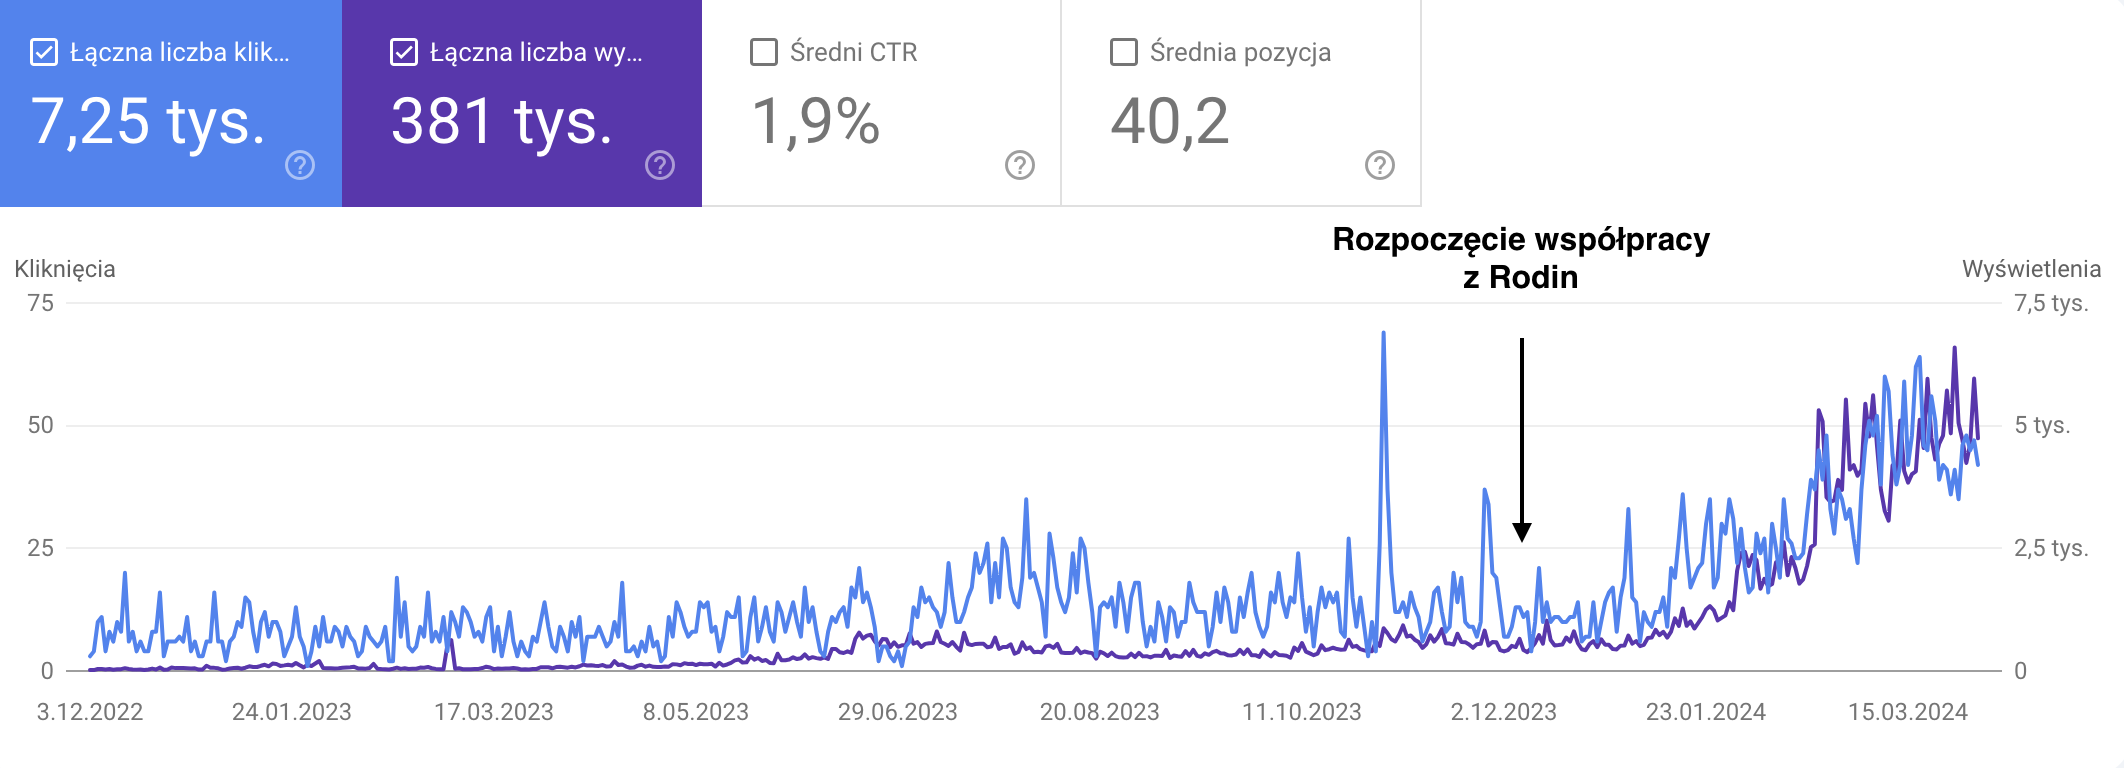
Currently, the website is visited by about 1,000 people per month, Facebook posts by 3,000 to even 11,000 people, and the number of conversions in Google Ads campaigns exceeds 40%.